

Do you look at stock charts and find them confusing? You're not the only one. At first glance, they can be incredibly confusing, but once you grasp the basics, you'll find that stock charts can actually give you a strategic advantage when investing.
This step-by-step guide will show you exactly how to read stock charts in clear, easy language. From chart type to pattern to the information that's truly important.
Every stock chart, no matter how fancy it looks, is built on a few simple ideas:
Once you have a grasp of these principles, you are all set.
Before digging deeper into the different types of stock charts and indicators, you may be asking yourself, "Why should I care about how to read a stock chart?"
Basically, a stock chart provides a history of a stock's price changes over a particular period of time. It is a historical representation of the behavior of buyers and sellers.
Once you get the hang of charts, you can:
Honestly, this is the first step into technical analysis for beginners. It’s what separates a lucky guess from real knowledge.
To really understand stock charts, you’ve got to know the big three:
If you’re serious about learning this stuff, candlestick charts are where most traders spend their time.
Getting comfortable with candlestick patterns is huge for understanding what’s happening in the market.
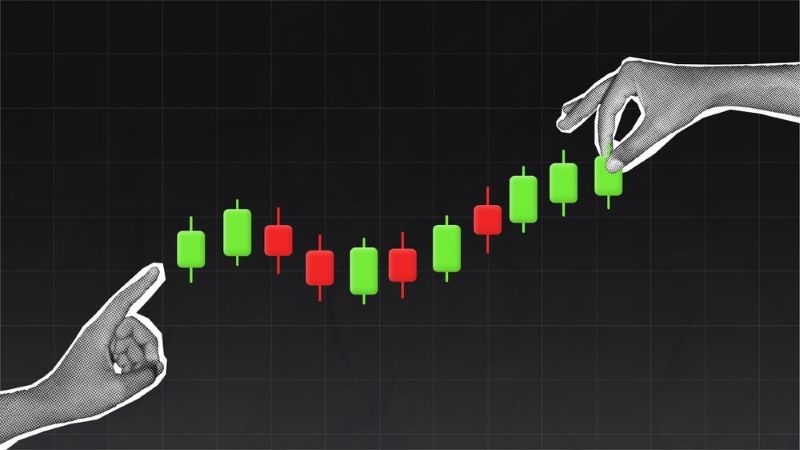
Each candle shows you where the stock opened, closed, and its high and low for that period. When the candle’s body is green or white, buyers push the price up. When it’s red or black, sellers win that round. It’s a quick way to see who has the upper hand.
Start with these beginner patterns:
Don’t waste energy memorizing every pattern out there. Focus on these, and pay attention to what they say about buyers and sellers. That’s how you start thinking like a real chart reader.
If you want to get better at reading stock charts, start with the support and resistance guide. They’re like your basic building blocks. Support is a price level where a stock almost always stops dropping and starts to rebound. Resistance is the spot where price rises come to a halt and often reverse. Imagine support as the floor—you hit it, then bounce up. Resistance acts like the ceiling that keeps the price from climbing higher.
You’ll see price ping-ponging between these barriers until something finally gives. When you understand these levels, you can time your entries, control your risk, and spot those big breakouts with more confidence.
Getting a handle on trends is one of the first things you should learn. An uptrend is pretty simple—prices keep hitting higher highs and higher lows. Downtrends are the exact opposite, with prices making lower highs and even lower lows. Sometimes, things just drift sideways. No big moves either way.
Here’s a trick: just draw a line through the important highs or lows. You’ll see which way the market’s leaning, and your charts will start making more sense as you keep practicing.
Patterns pop up on charts all the time. They’re not magic, but they can give you a heads up about what’s coming. You’ll run into patterns like triangles (that usually mean a breakout’s brewing), flags and pennants (which hint that the trend could keep going), and double tops or double bottoms (great for spotting reversals).
These patterns mean a lot more when they show up at strong support or resistance. That’s where you’ll see the biggest reactions.
A lot of new traders overlook volume, but you really shouldn’t. Volume tells you if a move actually has some muscle behind it.
When prices jump and volume surges, others in the market are paying attention. Moves on low volume? Usually weak, and often fakeouts. For example, a breakout above resistance means more if volume explodes. If there’s no volume, don’t be surprised if the breakout fizzles.
Here’s how you can piece it all together:
Stick to this formula, and reading stock charts won’t feel so overwhelming.
Even when you know the basics, it’s easy to trip up.
Steer clear of these traps, and you’ll get better (and a lot less frustrated) much faster.
Once you have the basics down, a few habits give you an edge.
Keep things simple and not overcomplicated. Practice a lot and keep your setup very easy.
Here's Something Helpful: Why Money Managers Profit and Management Fees Matter Most
Reading stock charts can feel intimidating, but it doesn’t have to be. Start small—get comfortable with the basics, like price moves and the main patterns. Layer in what you learn about support, resistance, and volume. Use a process of learning stock chart analysis basics and ignore the noise.
Give it time. After a while, charts start making sense—you’ll stop guessing and start reading the story they tell. Remember, you’re not trying to predict every tick. You’re just aiming to make better, more confident decisions one trade at a time.
Beginners can certainly learn how to read stock charts if they study consistently. In the beginning, focus on trends, support & resistance, and the basic candlestick patterns. Resist using complex indicators in the early stages, and build up from a simple knowledge base, or else your understanding may not be comprehensive.
Candlestick patterns alone should not form the basis of your trading decisions. Use them in conjunction with volumes, trends, support, & resistance levels. This will help to confirm signals and to prevent false readings.
For most beginners, daily charts are the best starting point, as they tend to filter out some of the 'noise', and clearer trends are visible. Intraday charts are too fast-paced for beginner traders to analyze accurately at first, and it is easier to pick things up when analyzing the bigger timeframes. Once comfortable with analyzing daily charts, you may experiment with intraday charts for more active trading.
Real expertise at technical analysis doesn't occur overnight and takes consistent study. For most beginners, tangible improvement can be expected within a few months of regular chart analysis. Real mastery comes from learning the many charts and continually comparing what you are seeing to what you have learned before, refining your techniques over the course of many observations.
This content was created by AI